For several years I tried to separate my blog posts into “academic philosophy” and “advocacy and social criticism”. This proved to be a difficult distinction to maintain, so in 2010 I included all posts in the Understanding Society blog. The posts you find here are the items that were published in Changing Society between 2007 and 2010.
Category: Uncategorized
Truth and reconciliation
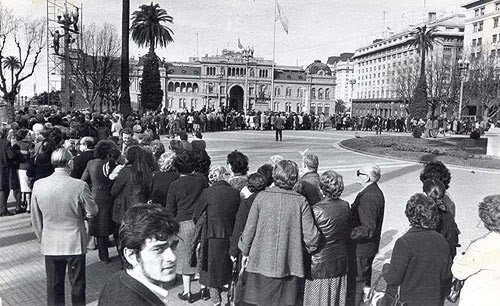
When does a society need a process of “truth and reconciliation” along the lines of such processes in South Africa, El Salvador, and Argentina? Here are some recent examples of truth and reconciliation processes: the fate of the “disappeared” in Argentina (link); Indian Residential Schools in Canada (link); Korean War civilian casualties (link); Liberian civil conflict (link); lynchings in the US South (link); and, of course, the Truth and Reconciliation Commission in South Africa (link).
The general theory of TRC is that a society is sometimes grievously divided over events and crimes that have occurred in the past, and that honest recognition of those crimes may lay a foundation for reconciliation within the society. Here is a summary statement of the purpose of a Truth and Reconciliation Commission from the South African Ministry of Justice:
… a commission is a necessary exercise to enable South Africans to come to terms with their past on a morally accepted basis and to advance the cause of reconciliation.
But what more can we say about what facts might trigger the need for a TRC process?
First, such a process is only invoked when there is a serious history of injustice within the community, leading to a situation in which one group has been badly treated by other groups or powerful institutions. The stakes need to be high for current members of society in order to justify establishing a TRC.
Second, a TRC process seems to be most needed when the consequences of the past injustice persist into the present: the bad things that happened in the past continue to burden some groups in the present.
Third, there is an implication of abiding resentment and rancor within the current population. The injustice of the past continues to be a source of emotional division between members of the relevant groups. This is the reconciliation part of the agenda: by honestly confronting the facts about the past injustices, the groups subject to this treatment may be in a better place to resolve their rancor. And more practically, honest recognition of the past may lead to concrete steps in the present to restore the interests and rights of affected groups.
Fourth, there is a common feature of violence and subjugation in the instances where TRC processes have been invoked to date: pogroms, mass killings, lynchings, and other forms of inter-group violence.
So what are some important examples of historical circumstances where TRC is called for? There are many:
- The expatriation of French Jews by the French government into the hands of the Nazis, leading to the deaths of thousands of people from this community.
- The Rwandan genocide.
- The Argentine military’s policy of “disappearing” large numbers of its opponents, involving secret imprisonment, torture, and murder.
- White violence against black people in the American South, enforcing white power through lynchings, shootings, and violent intimidation.
- Organized ethnic cleansing and mass murder in Croatia, Bosnia, and Slovenia.
- The fact of slavery as practiced in the United States through Emancipation.
- The crimes of death squads in El Salvador in the 1980s, including a degree of US support and involvement.
- Robert Mugabe’s use of ZANU-PF paramilitary thugs in Zimbabwe to maintain his political power.
Here is the immediate question of interest in this posting: how do the facts of northern race relations fit into the parameters of truth and reconciliation? In the Detroit area the Michigan Roundtable for Diversity and Inclusion is calling for a Truth and Reconciliation Commission to honestly examine the history of race and residence in the region (link). The Roundtable states that —
The establishment of a Truth and Reconciliation Commission, inspired by the process that took place in South Africa, will allow us to develop an appropriate understanding of past injustices and to envision constructive remedies to create a new regional culture of fairness, equal opportunity and prosperity.
(Here is a link to the Facebook page for the organization in which the initiative is launched.)
So let’s ask the crucial question: are the patterns of racial segregation and inequality of opportunity that are unmistakably involved in most US large cities an appropriate cause for a process of truth and reconciliation?
In many ways the answer appears to be “yes.” Urban segregation was and is a source of massive injustice for black Americans. It embodied a quasi-permanent pattern of inequality of opportunity and outcome on African-American citizens. It was the result of specific but often hidden social practices that embodied a pattern of white privilege. And these practices sometimes involved actual and threatened violence. So entrenched discrimination and segregation constitute social harms that meet most of the criteria mentioned above, and the truth about the underlying mechanisms is not widely known.
In short, most honest observers would probably agree that the history of racial segregation in Southeast Michigan reflects serious injustice and continues to inflict harms on people in the region today. These harms include disproportionate levels of poverty, unemployment, inadequate education, and differential health outcomes. And many would agree as well that social injustices of this magnitude need to be addressed openly and honestly.
The map of the Detroit metropolitan area below represents a measure of “neighborhood opportunity” across the region. It is published in an important report, “Opportunity for All,” by john a. powell and the Kirwan Institute for the Study of Race and Ethnicity at Ohio State University (link). What it documents in a very visual way is the current effects of past and present practices of residential segregation: the areas of high African-American population line up very precisely with the areas of low “neighborhood opportunity”. (Here is a keynote address by john a. powell to the Michigan Roundtable for Diversity and Inclusion (link) that lays out the data in great detail.)

So a sustained and honest effort to uncover and disseminate the historical causes of these patterns of racial segregation in the region is a positive step forward.
What is perhaps more difficult to answer is the question of efficacy. Do these TRC processes actually work? Do they succeed in changing attitudes in the populations in which they operate? Do they help communities develop more harmonious and collaborative approaches to the problems they face? And does “truth” lead to “reconciliation” in a significant number of cases? The Michigan Roundtable conducted a survey of racial attitudes in Michigan in 2009, and one question in particular stands out. In 2009 56% of residents said that we will have racial equality “in 100 years” or “never,” compared to 48% in 2008. In other words, well over half of all Michigan citizens despair of achieving racial equality within five generations. And 68% of African American citizens in Michigan expressed the same lack of hope. We need to do better than this at achieving real racial equality; the question is, whether the proposed Truth and Reconciliation Commission can help us move forward in practical and effective ways.
A Michigan job loss tsunami
The whole country knows that unemployment is very high in Michigan, and most people also know that the automotive manufacturing industry has taken a nose dive in the past five years. But the situation is even worse than most people imagine. Bureau of Labor statistics indicate several important facts. In 2000 the total private sector employment in the United States was 110,798,000; by August 2009 this number had dropped to 109,540,000 — a net loss of 1,258,000 jobs nation-wide. This is a 1.1% drop. In 2000 the number of private sector jobs in Michigan was 3,996,000; this number dropped to 3,213,000 by August 2009 — a drop of 783,000 jobs (19.6%). This is a shocking number — one out of five jobs in Michigan has disappeared since 2000.

Other Midwestern manufacturing states also had significant job losses during the period. Ohio lost 9.8% of its 4,840,000 jobs since 2000, and Illinois lost 6.6% of its 5,205,000 jobs since 2000. But Michigan’s losses dwarf every other state by a large margin. Among the fifty states and the District of Columbia there were winners and losers; 25 states gained private sector jobs during these years, with Texas the big winner (700,000 new jobs). Altogether 1,952,000 new jobs were created in 25 states and 3,207,000 jobs were lost in 25 states and DC. But consider this: fully 24% of all private sector job losses nation-wide occurred in Michigan during this time period. Think of that: one out of four of all private-sector job losses in the country during these years occurred in one state, Michigan. This could reasonably be called a one-state depression. It is as if a slow-moving Katrina had hit the state, and no one noticed.
So what is needed in order for Michigan to regain its economic wellbeing?
Plainly a 20-30% unemployment rate is unacceptable. So if the state maintains its current population, then the communities, businesses, and government of the state need to stimulate substantial job growth. And we can put some numbers on this obvious truth. If the population remains constant then it would take eight years for the state to recover to the 2000 level if jobs grow at 3% per year. And this would require the creation of about 100,000 new private sector jobs each year.
What would be needed in order to get to 100,000 new jobs per year in Michigan? Here is one pathway: succeed in attracting or creating —
- two large firms of 5,000 workers,
- 10 firms of 1000 workers,
- 50 firms of 500 workers,
- 400 firms of 100 workers,
- 1500 small businesses of 10 workers, and
- 2000 small businesses that expand by three workers.
That gets us to 106,000 new jobs. And it means creating or attracting two large firms, almost 2,000 small and medium businesses, and expanding another 2,000 small businesses. And this needs to happen every year for eight years.
Is this feasible? Is it possible for a state of about 10 million people to create new businesses and jobs on this scale? That is the crucial question for the state of Michigan. And there are many organizations and incubators devoted to this goal in the state of Michigan — Ann Arbor SPARK, TechTown, Automation Alley, Detroit Renaissance, Michigan Economic Development Corporation, and the Detroit Regional Chamber, to name a few. Further, the universities are doing everything possible to help provide the talented graduates and the new innovations that will be needed for the creation of successful new businesses. But ultimately it is very hard to see how this kind of business creation and job growth can occur year after year.
So Michigan’s problem is also a crucial challenge for the nation as a whole. The plain truth is that Michigan has born the largest burden of the decline of manufacturing jobs in the past decade, and the solutions may be beyond the grasp of the state itself. This situation may require intelligent and substantial Federal solutions.
Improving schools
Finding ways to significantly and sustainably improve the effectiveness of public schools in high poverty areas is one of the most urgent problems facing us — particularly when we aim to reduce the inequalities that exist around race and poverty in our nation’s cities. New thinking about schools and curricula has given rise to some practical strategies for achieving this kind of improvement.

For example, the Center for Social Organization of Schools at Johns Hopkins University is a particularly creative place for using research and development to find replicable ways of improving school success in high-poverty areas. Here is the mission statement for CSOS:
The Center for Social Organization of Schools (CSOS) was established in 1966 as an educational research and development center at Johns Hopkins University. The Center maintains a staff of full-time, highly productive sociologists, psychologists, social psychologists, and educators who conduct programmatic research to improve the education system, as well as full-time support staff engaged in developing curricula and providing technical assistance to help schools use the Center’s research. The Center currently includes the federally-supported Center for Research on the Education of Students Placed At Risk, and the Center on School, Family and Community Partnerships. link
The Talent Development Middle Grades Program (link) is one of the promising efforts that have been spearheaded by CSOS. This program attempts to implement school-level programs that substantially change the odds for the middle grade students who are at risk for dropping out. And the alarming fact is that likely high school dropouts can be identified by the sixth grade, based on factors such as attendance, poor academic progress, and behavioral problems. So reversing these factors early is key to improving high school completion rates six to eight years later. Mentorship for students, professional development for teachers, close teamwork within schools among teachers and principals, implementation of a challenging curriculum for all students, and extra-help labs to help students stay on track are the key strategies that work, according to CSOS research. School organization and climate are critical factors, and they can be addressed through district-level reform efforts (link).
What are the interventions that are shown to be effective? The CSOS Talent Development High Schools Program (link) provides quite a bit of useful research and program reform recommendations. Here is the mission statement for this program:
The Talent Development High School Model is a comprehensive reform model for large high schools facing serious problems with student attendance, discipline, achievement scores, and dropout rates. The model includes organizational and management changes to establish a positive school climate; curricular and instructional innovations to prepare all students for high-level courses in math and English; parent and community involvement to encourage college awareness; and professional development to support the recommended reforms.
The program reform model highlights curricula with high expectations, extended class periods, formal extra help programs, professional development and teaming for teachers, and family and community involvement.
Another important current initiative — also inspired by research at CSOS — is the Diplomas Now initiative that is underway in partnership with CityYear, Talent Development, and Communities in Schools. This program is a response to the severe high school dropout crisis our nation faces, especially in high-poverty cities. Here is a description of this program:
- Diplomas Now pairs evidence-based, comprehensive school reform with national service teams to provide tutoring, mentoring, monitoring and engagement activities at the required scale, and integrated student supports for the highest need students.
- Diplomas Now unites three organizations – Talent Development, City Year and Communities In Schools – each one with years of experience in youth service and third-party evidence of impact on helping students succeed. The Philadelphia Education Fund also serves as a national training and technical assistance partner. The partners complement each other and also collaborate well with local education reform efforts.
- Diplomas Now works closely with school administrators and teachers to identify off-track youth and develop, implement and sustain comprehensive, targeted and customized strategies to get them back on track. Diplomas Now is deliberately designed to incorporate, complement and accelerate the impact of other promising and innovative efforts that aim to boost post-secondary success.
There are a number of promising initiatives underway across the country that are aimed at achieving significant and sustainable improvement in K-12 learning outcomes. It is important that schools find the partnership they need from government and foundations to implement the ideas that work. The Obama administration has committed quite a bit of energy and funds to this effort; let’s hope that it pays off throughout urban America.
Obama and the cities
 photo: Cabrini Green housing project, Chicago (now demolished)
Is the Obama administration doing enough to address the problems of urban poverty and lack of opportunity for poor people in cities?
The situation of poverty, inequality, and deprivation in most of America’s cities is severe. Wherever regional studies of health status have been carried out, inner cities show up as abnormally unhealthy populations. Unemployment rates in large cities are generally significantly higher than state and national averages. High school completion rates are lower — often shockingly lower. Housing stock and neighborhoods are in poor condition. Fresh fruits and vegetables are difficult to come by — because large grocery stores have often moved outside city limits. And all of this implies that the overall quality of life for the poorest half of most urban populations in the U.S. is low. (Here is a 1988 publication on estimates of urban quality of life — the most recent I can find!)
There is no doubt that President Obama is aware of the gravity of the urban crisis. He knows Chicago intimately, a city that reflects many of these life-limiting circumstances for several million poor people. And his speech of July 18, 2007 reflects an acute understanding of the problem and a commitment to help the country address the crisis. But the question still needs asking: in the first six months of the Obama administration, has there been enough attention given to the problems of cities in America? And so far, the answer seems to be “no.”
These are problems that demand federal solutions. States are generally fiscally unable to take the steps that would significantly improve the economic prospects for urban people in Cleveland, Oakland, Miami, Detroit, or Hartford. And all too often state legislatures are dominated by an anti-urban bias that makes significant state investment unlikely in any case. But cities represent a national crisis, not simply a regional crisis. As Richard Florida emphasizes (CreativeClass), cities are potentially the source of the greatest resources of creativity and growth that the country possesses. But too many American cities are hobbled by concentrated poverty, failing schools, corrupt city administrations, and zero-sum politics, with predictable results. The new businesses, technology innovations, and high-end service providers that should be the basis of revitalization of America’s cities are simply not showing up downtown. There is very, very little progress in quality of life for the poorest 60% of people living in cities across the country.
Moreover, it needs to be recognized that a central part of this puzzle has to do with race. American cities seem to have become machines for reproducing poverty among African-Americans, Latinos, and other minority populations. Far from being a post-racial society, our cities threaten to become a permanent location of racial disadvantage. Residential segregation, discrimination in employment, and a public education system that is sharply racialized in effect seems to create a set of interlocking institutions that make it all but impossible to narrow the race gap — in income, quality of life, health status, or education.
So where is the Federal agenda for urban transformation? One of President Obama’s priorities is education reform for K-12 schools, and this is certainly relevant and important as a means of addressing poverty and racial inequalities. But it isn’t enough. Somehow we need initiatives that will change the game for the tens of millions of disadvantaged children and young people in American cities; that will give them the opportunity to gain the education and skills that will allow them to find their place in a vibrant economy; and to reduce the unacceptable but persistent inequalities of basic life prospects that our cities still create for so many Americans.
Wealth inequality


When we talk about inequality in the United States, we usually have a couple of different things in mind. We think immediately of income inequality. Inequalities of important life outcomes come to mind (health, housing, education), and, of course, we think of the inequalities of opportunity that are created by a group’s social location (race, urban poverty, gender). But a fundamental form of inequality in our society is a factor that influences each of these: inequalities of wealth across social groups. Wealth refers to the ownership of property, tangible and intangible: for example, real estate, stocks and bonds, savings accounts, businesses, factories, mines, forests, and natural resources. Two facts are particularly important when it comes to wealth: first, that wealth is in general very unevenly distributed in the United States, and second, that there are very striking inequalities when we look at the average wealth of major social groups.
Edward Wolff has written quite a bit about the facts and causes of wealth inequality in the United States. A recent book, Top Heavy: The Increasing Inequality of Wealth in America and What Can Be Done About It, Second Edition, is particularly timely; also of interest is Assets for the Poor: The Benefits of Spreading Asset Ownership.
Wolff summarizes his conclusion in these stark terms:
The gap between haves and have-nots is greater now–at the start of the twenty-first century–than at anytime since 1929. The sharp increase in inequality since the late 1970s has made wealth distribution in the United States more unequal than it is in what used to be perceived as the class-ridden societies of northwestern Europe. … The number of households worth $1,000,000 or more grew by almost 60 percent; the number worth $10,000,000 or more almost quadrupled. (2-3)
The international comparison of wealth inequality is particularly interesting. Wolff provides a chart of the share of marketable wealth held by the top percentile in the UK, Sweden, and the US, from 1920 to 1992. The graph is striking. Sweden starts off in 1920 with 40% of wealth in the hands of the top one percent, and falls fairly steadily to just under 20% in 1992. UK starts at a staggering 60% (!) in the hands of the top 1 percent in 1920, and again, falls steadily to a 1992 level of just over 20%. The US shows a different pattern. It starts at 35% in 1920 (lowest of all three countries); then rises and falls slowly around the 30% level. The US then begins a downward trend in the mid-1960s, falling to a low of 20% in the 1970s; and then, during the Reagan years and following, the percent of wealth rises to roughly 35%. So we are roughly back to where we were in 1920 when it comes to wealth inequalities in the United States, by this measure.
Why does this kind of inequality matter? Partly because significant inequalities of wealth have important implications for such things as the relative political power of various groups; the opportunities that groups have within and across generations; and the relative security that various individuals and groups have when faced with economic adversity. People who own little or nothing have little to fall back on when they lose a job, face a serious illness, or move into retirement. People who have a lot of wealth, by contrast, are able to exercise a disproportionate amount of political influence; they are able to ensure that their children are well educated and well prepared for careers; and they have substantial buffers when times are hard.
Wolff offers a good summary of the empirical data about wealth inequalities in the United States. But we’d also like to know something about the mechanisms through which this concentration of wealth occurs. Several mechanisms come readily to mind. People who have wealth have an advantage in gathering the information necessary to increase their wealth; they have networks of other wealth holders who can improve their access to opportunities for wealth acquisition; they have advantages in gaining advanced professional and graduate training that increase their likelihood of assuming high positions in wealth-creating enterprises; and they can afford to include high-risk, high-gain strategies in their investment portfolios. So there is a fairly obvious sense in which wealth begets wealth.
But part of this system of inequality of wealth ownership in the United States has to do with something else: the workings of race. The National Urban League publishes an annual report on “The State of Black America.” One of the measures that it tracks is the “wealth gap” — the differential in home ownership between black and white adults. This gap continues to persist, and many leaders in the effort towards achieving equality of opportunity across racial groups point to this structural inequality as a key factor. Here is a very good study on home ownership trends for black and white adults done by George Masnick at the Joint Center for Housing Studies at Harvard (2001). The gap in the 1990s fluctuated around 28% — so, for example, in 1988-1998 about 52% of blacks between 45 and 54 were home owners, whereas about 80% of non-Hispanic whites in this age group were homeowners (figure 5). Historical practices of mortgage discrimination against specific neighborhoods influence home ownership rates, as do other business practices associated with the workings of residential segregation. Some of these mechanisms are illustrated in Kevin Kruse and Thomas Sugrue’s The New Suburban History, and Kevin Boyle’s Arc of Justice: A Saga of Race, Civil Rights, and Murder in the Jazz Age
provides an absorbing account of how challenging “home ownership” was for professional black families in Detroit in the 1920s.
So what are the remedies for the very high level of wealth inequality that is found in the United States? Wolff focuses on tax remedies, and certainly these need to be a part of the story. But remedying the social obstacles that exist for disadvantaged families to gain property — most fundamentally, disadvantages that derive from the educational opportunities that are offered to children and young people in inner-city neighborhoods — is crucial as well. It seems axiomatic that the greatest enhancement that can be offered to a young person is a good education; and this is true in the question of wealth acquisition no less than the acquisition of other socially desirable things.
Twitter in Thailand


I’ve been following the twitter feed on #redshirt for a week now (since April 11, the day the red shirt demonstrators invaded the Pattaya resort hosting the ASEAN meeting). (See an earlier post on the civil unrest there.) It’s been truly fascinating in many ways.
(It’s a big disadvantage, of course, not to be able to read Thai; so there is a segment of the feed that I can’t address at all.)
Here are a few things I’ve gathered in the week of reading. I’ve become familiar with a couple of voices — bangkokbill, andrewspooner, anitchang, smartbrain, piriya … I’ve learned a bit about the timing of events in Bangkok during the Sunday and Monday showdown with the government. I’ve probably gotten a bit of the flavor of the issues and emotions that divide the contending protest movements, red and yellow. I got some useful links to valid news and academic sources on the conflict.
And I’ve viewed the controversy about who is REALLY dominating the twitter feed — yellow shirts or red shirts. Andrew Spooner is out front in asserting that yellow shirts are spinning the facts in the twitter feed; others characterize him as “pro-red shirt” and biased in that direction. It’s gotten a bit personal — maybe it’s a good thing Spooner is off on a travel article assignment. But actually — I’m not seeing the evidence of bias that Spooner sees.
Another interesting aspect of the feed — there are only a few eye witness real time comments from the streets — certainly few compared to the ongoing commentary by the regulars. And there appear to be no real time reports from participants — red shirts or conceivably cops and soldiers.
The biggest issues of debate that people are clashing about on twitter are important ones. Did the government use more force than necessary? Were there more deaths than the four that were reported? Were more bodies secretly taken away? (This is a persistent theme in Spooner’s postings.)
And second, how does the “street” feel about the demonstrations? Is there more support for the yellow shirts and the current government, or is there mass support for the red shirts and Thaksin? Are the red shirt demonstrators mostly concerned about democracy and social progress, or are they dupes of Thaksin’s party?
Spooner makes what sounds like a valid point about access — it makes sense that poor people who might support Thaksin are less likely to have access to twitter and the Internet. But since you can tweet straight from a cell phone, this doesn’t seem to be much of a barrier. There are a lot of cell phones in Bangkok!
What never really gets addressed directly is the extent of mob violence exerted by red shirts on several occasions last weekend: the invasion of Battaya, invasion of the ministry of interior, smashing of the vice minister’s car and serious beating of the official himself, and the burning of numerous buses. All of this is well documented in the press and on YouTube — but almost never mentioned in the twitter polemics.
And of course there’s the mysterious assassination attempt on the life of a former official, Sondhi, who was a prominent figure in the yellow shirt demonstrations in the fall — some mention of this shooting on the twitter feed but no real news.
What is truly fascinating about the demonstrations in Bangkok this past week, and the twitter feeds that emanated as a result, is what it suggests about the future. Imagine that 10% of demonstrators contribute comments and feelings every few hours; imagine the freelance commentators and partisans are putting in their interpretations; and imagine the parties and the government make an effort to chime in and provide spin, interpretation, and misinformation. This would be a torrent of as many as four thousand tweets an hour for an extended time — perhaps 350,000 tweets to make sense of in a week. What a data-rich cacaphony for the journalist, the sociologist, and the intelligence analyst to try to make sense of. Thailand 2009 isn’t the twitter revolution — but maybe the next one will be.
What’s next?


We’ve seen several waves of hardship for working families in the past eight months in many parts of the U.S.: mortgage foreclosures, job losses, reduction of hours of work, and pressure by employers on health benefits. And state governments around the country are under huge fiscal pressure, leading them to attempt to cut support for social programs and important social services. And many of those governments are themselves laying off state workers. So there is already an unprecedented level of economic and personal distress in the country.
But no one seems to think that we’ve seen the worst this recession has to offer. So what’s next?
One part of the story seems pretty clear. There will be more layoffs, more plant closures, and more business bankruptcies in the coming six months. So more families will suffer the pain and dislocation of job loss. The national unemployment rate is officially estimated at 8.5%, and economists expect it to rise above 10%. This means another two million job losses in the coming year or so. And each unemployed person affects several around him or her — dependent children, spouses, college-age children, even aging parents. That amounts to several million more people about to be affected. (Here’s a link to the Bureau of Labor Statistics.)
It also seems likely that many more people will lose their homes through foreclosure. (Here’s a recent map of mortgage delinquency rates based on data compiled by the New York Federal Reserve Bank.)
It would take more of an expert than me to try to guess what surprises await us in the financial sector — how many more failed banks, how long the credit drought will continue, how much resistance distressed home mortgage holders will meet in efforts to renegotiate their loans and try to keep their homes. But it doesn’t seem likely that banking and finance have seen the worst yet.
We can pretty well predict that services and support for urban poor people will diminish further, as state budgets contract along with the economy. And public health experts can probably estimate the effects that contraction will have, on the health and nutrition status of poor communities. And what happens to whole communities when unemployment benefits begin to run out? How will food pantries and private services cope with increasing urgent need?
And what about worker militancy? Isn’t it somewhat surprising that there hasn’t been more of an organized reaction in the United States to all these shocks by the ordinary people who are experiencing them? Is it possible that this passivity and acceptance will begin to change as the months of hardship wear on into years of reduced quality of life?
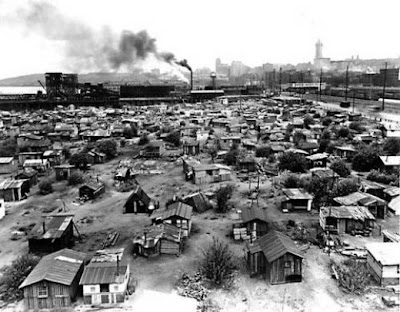
The photos above are from the 1930s, the period of the Great Depression. The point here isn’t that we’re approaching a similar time. It is simply that economic hardship is real, and it forces new kinds of social action and private strategies of self-preservation.
I suppose the hope everyone shares is that the economy will reignite. Demand will begin to recover; businesses will start to rehire workers; new investments will be made that result in productive innovations. And public revenues will begin to recover as well, as family incomes, business profits, and property values start to recover. So we’ll be able to pay for the social services we want and simple fairness demands.
Somehow, though, that recovery seems a long way off.
Anti-NATO protests in Strasbourg

There are organized and escalating protests taking place against the NATO summit in Strasbourg this week (news; news; Aljazeera report). Calls for protest have come from anti-war and leftist organizations throughout Europe, and there is rising concern in the French and German press about the possibility of violence in the streets. These concerns are realistic, since clashes between demonstrators and police have taken place already in the past twenty-four hours.
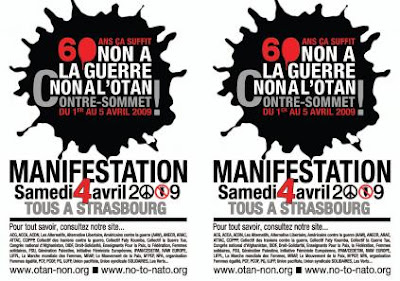
These protests are separate from those taking place in London at the G20 meetings, and there appears to be an escalating cycle of violent clashes between demonstrators and police and security forces. Various European anti-war organizations have been mobilizing to bring their supporters to Strasbourg — for example, see this website for Manchester Stop the War Coalition and this call for action from Americans for Peace and Justice (posted in Italy).
What is the composition of the protest movement in Strasbourg today? It would appear to be largely organized by anti-war and pacifist groups; groups who are opposed to European involvement in Afghanistan; some groups protesting the recent war in Gaza; and, presumably, a scattering of anti-globalization and anarchist groups from various parts of Europe. Anti-NATO demonstrations have taken place with some regularity in a variety of locations in Europe in the past year.
President Obama will be visiting Strasbourg and Baden-Baden this week for the NATO conference, and security in the city is very intense. The French public is very tuned into the developments that are taking place in the city. There will be a great deal of American and European attention to his visit. It is very striking, though, that there is virtually no coverage of the protests and clashes that are currently taking place in Strasbourg in the American press. The New York Times appears not to have covered the story, though it has covered the NATO conference itself.
It would be very interesting to use the tools available on the web to do a sociology of the protests taking place today, based on the links it is possible to discover among organizations through websites and calls for mobilization. Sidney Tarrow is one of the contemporary social scientists who has made a substantial effort to provide detailed analysis of the networks and organizations that have converged in anti-globalization protests in the past decade or so (The Global Justice Movement: Cross-national And Transnational Perspectives).
Unemployment in the US

There is a good interactive map of unemployment rates at the county level across the US in the March 29 New York Times. Here is a snapshot, but be sure to visit the Times site for the interactive version. The map is based on January 2009 data, and it represents a national rate of unemployment of 8.5%. But there is a tremendous range across regions and counties.
There are many noteworthy details on the map. Northern California and Oregon somewhat surprised me; Harney County, Oregon, has a rate of 19.7% unemployment, and Trinity County, California, has a rate of 20.9%. These are staggering numbers for these locales.
My own state, Michigan, has a very wide range of unemployment rates across both rural and urban counties. Wayne County, home of the city of Detroit, has a relatively high rate of 14.2%, and Genesee County, home of Flint, also has a high rate (14.8%). (By comparison, Onondaga County, home of Syracuse, New York, has a rate of 7.4%.) Several Michigan counties with mid-sized cities show relatively low unemployment rates: Washtenaw County (Ann Arbor), Kalamazoo County (Kalamazoo), and Kent County (Grand Rapids) have relatively low rates (7.3%, 8.4%, 9.8%). But several other counties in the state show rates in excess of 18%: Cheboygan County (21.8%), Baraga County in the Upper Peninsula (23.4%), Sanilac County (18.9%), and Iosco County (18.5%). What this shows is that the unemployment crisis is not evenly distributed across the state or the region; some counties are much more seriously affected than others. And some of the highest rates are in counties with agriculture and extraction as primary industries — manufacturing counties in Michigan are generally in the middle rank.
A quick visual inspection suggests that Michigan and South Carolina are the states with the highest proportion of high-unemployment counties; California and Oregon are also clearly on the high end of the unemployment crisis.
The tool also allows the user to select for rural, manufacturing, metropolitan, and “housing bubble” counties.
I suppose that the central truth that this map supports is the fact that the employment crisis has affected regions and economic sectors very differently — across large regions and within states. So here, as with so many social variables, it is important to disaggregate the national and state data, to get a better idea of the range of effects a given economic circumstance is creating for individuals and families.
